Dividend Dashboard
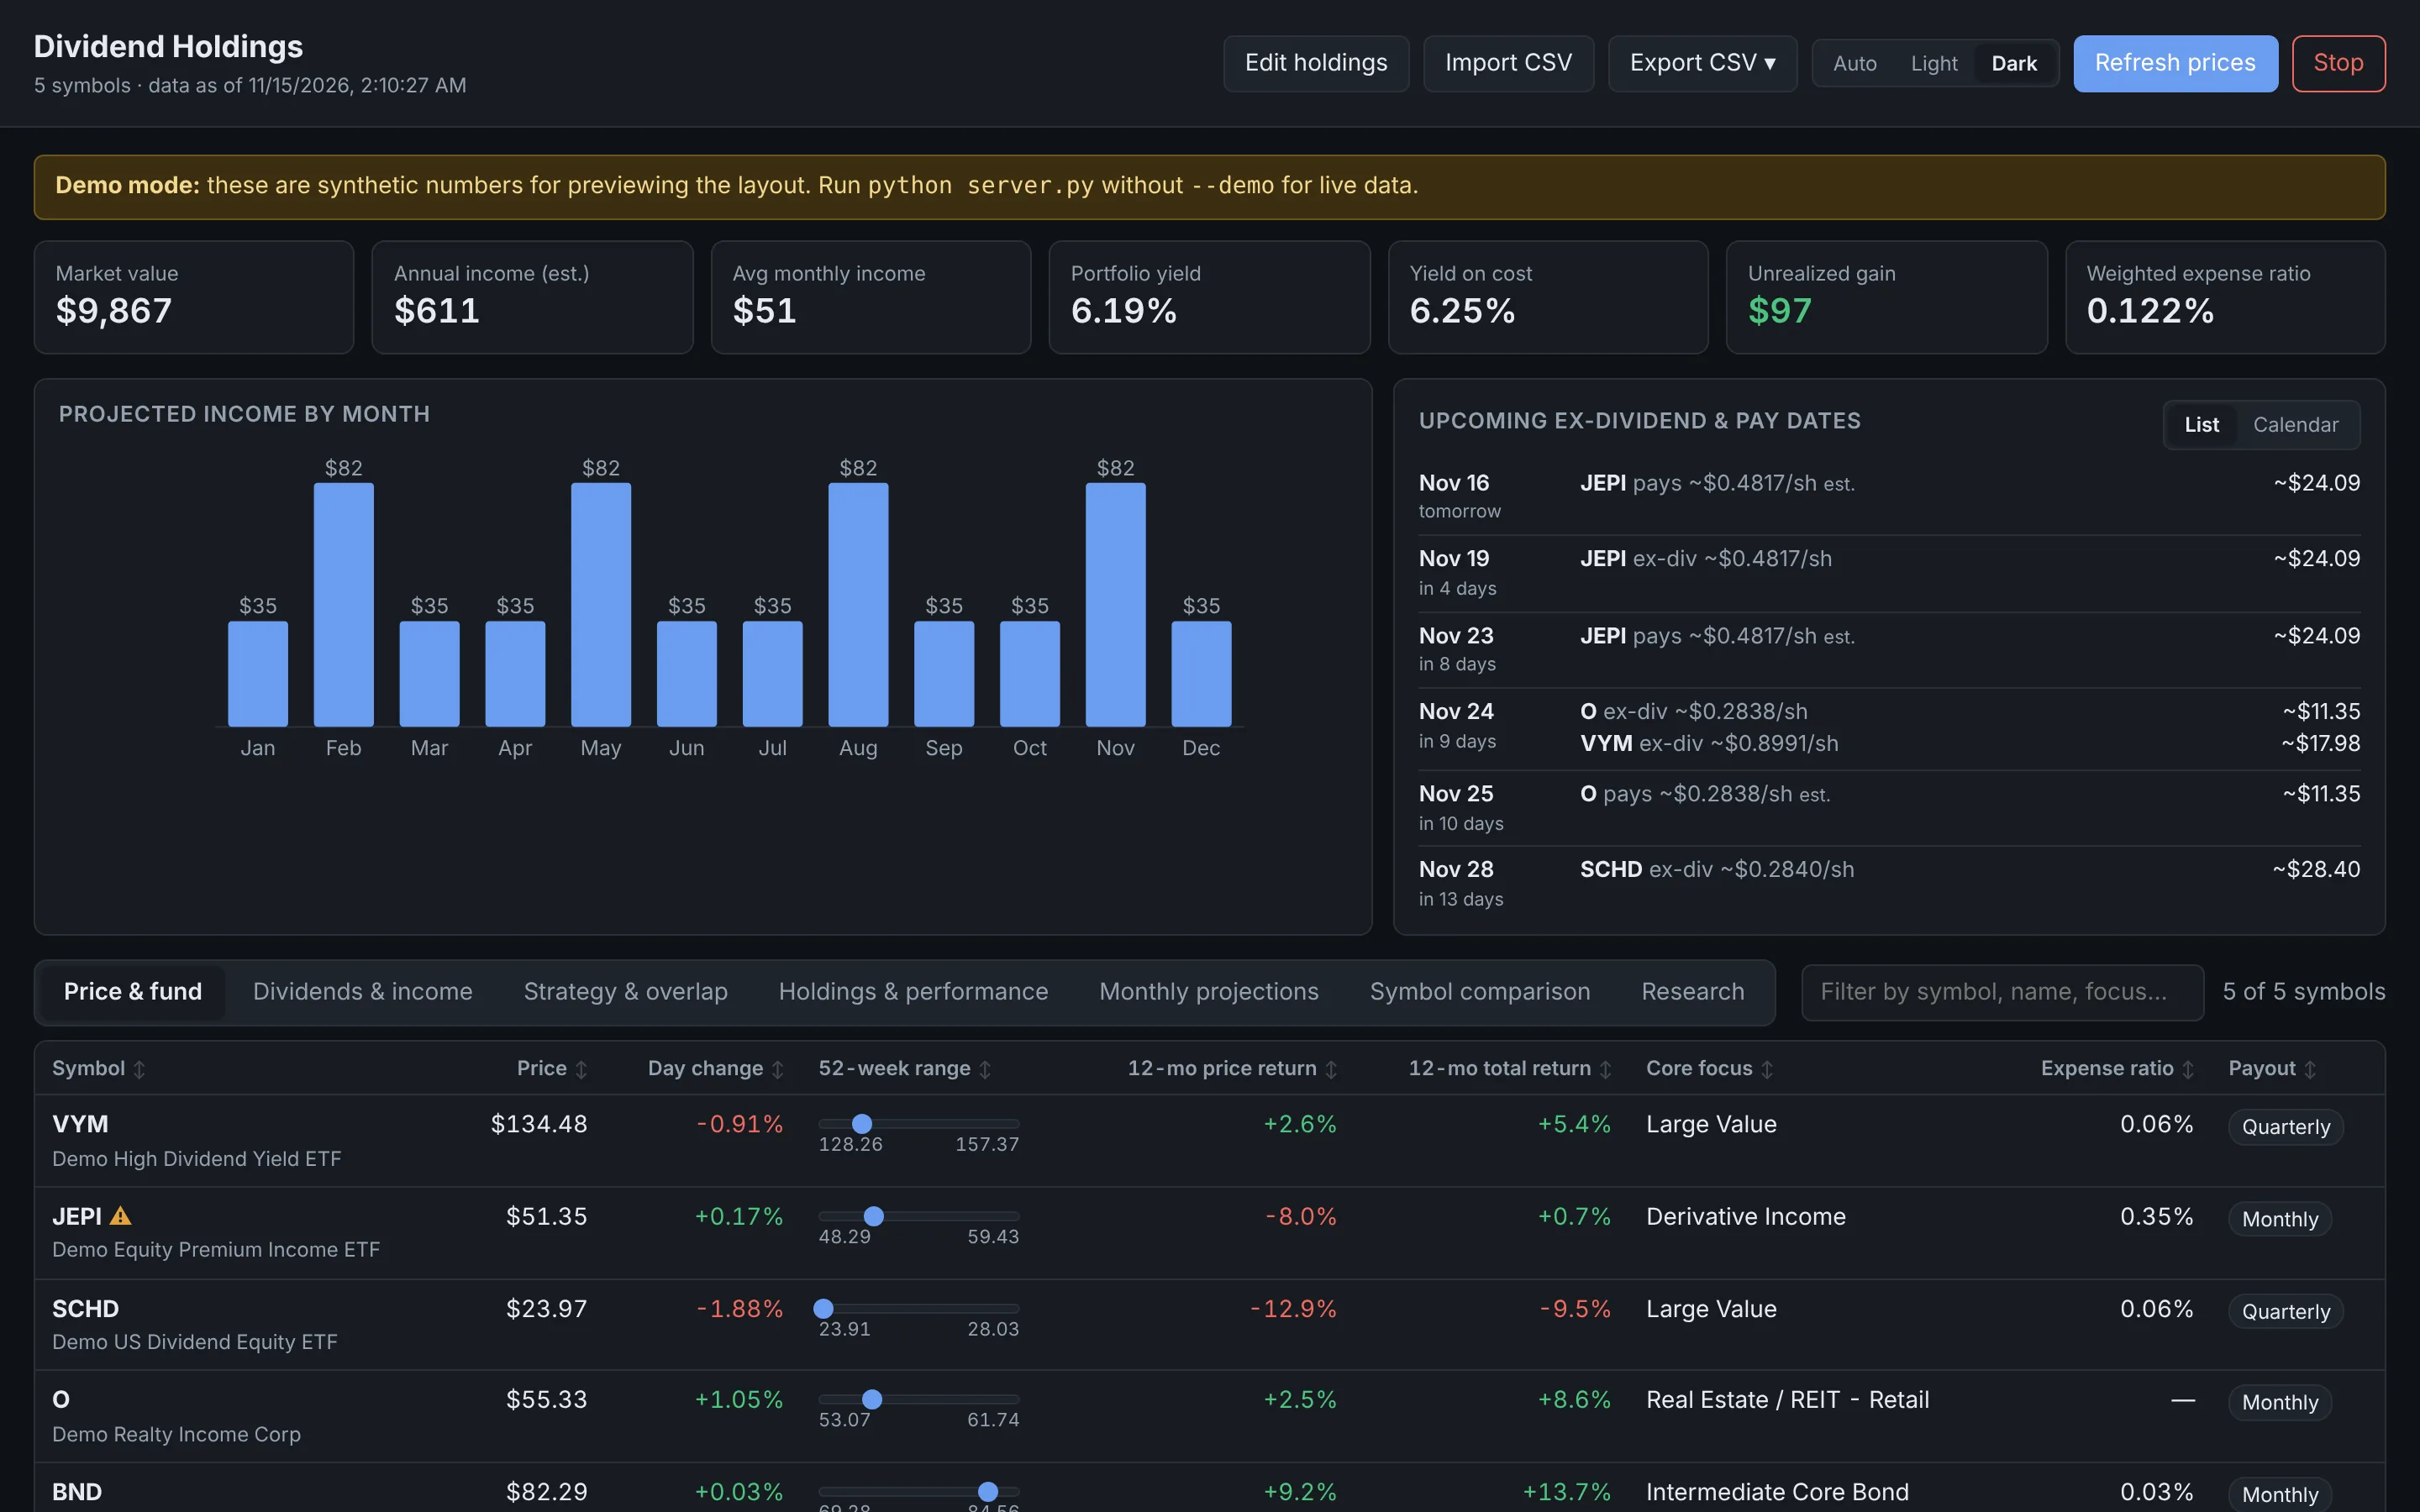
A small dashboard for your dividend ETFs, funds and stocks that runs on your own computer and opens in your web browser. It pulls free Yahoo Finance data, needs no API key or account, and uses only Python's standard library, so there's nothing extra to install (and nothing for Windows Smart App Control to block).
Why I built it
I wanted one page that answers the questions I actually ask about my dividend holdings: how much income to expect each month, when the next ex-dividend dates are, which funds overlap, and whether a high yield is hiding a falling price. Brokers spread that across many screens, and most tools want an account or a paid API key. This one keeps my holdings on my own machine.
At a glance
| Runs on | Windows, macOS, Linux (Python 3.9 or newer) |
| Data | Yahoo Finance, cached for 15 minutes; optional yfinance fallback |
| Your holdings | A plain holdings.csv you can edit in the page or in Excel |
| Privacy | Runs at http://127.0.0.1:8765; holdings never leave your computer |
| Dependencies | None beyond the Python standard library |
| License | MIT |
Highlights
- Portfolio tiles: market value, annual and monthly income, yield, yield on cost, unrealized gain, weighted expense ratio and the next ex-dividend date.
- Income calendar: projected income by month plus upcoming ex-dividend and pay dates.
- Strategy & overlap: what each fund is exposed to, its options strategy, and how much your funds' top holdings overlap.
- Symbol comparison and Research: compare up to 10 tickers over 1M to Max, or look up any symbol you don't own yet.
- Warning flags: very high yield, recent dividend cut, possible NAV decay, high expense ratio and erratic payouts.
- Works across computers: share one holdings file through a cloud folder, or export and import with a preview of every change.
See the full feature tour or the screenshots.
Note
This is for information only, not investment advice. Data comes from Yahoo Finance and can be delayed, estimated or wrong.