Screenshots
All screenshots use the built-in demo data (python server.py --demo), so the holdings and dollar amounts are synthetic.
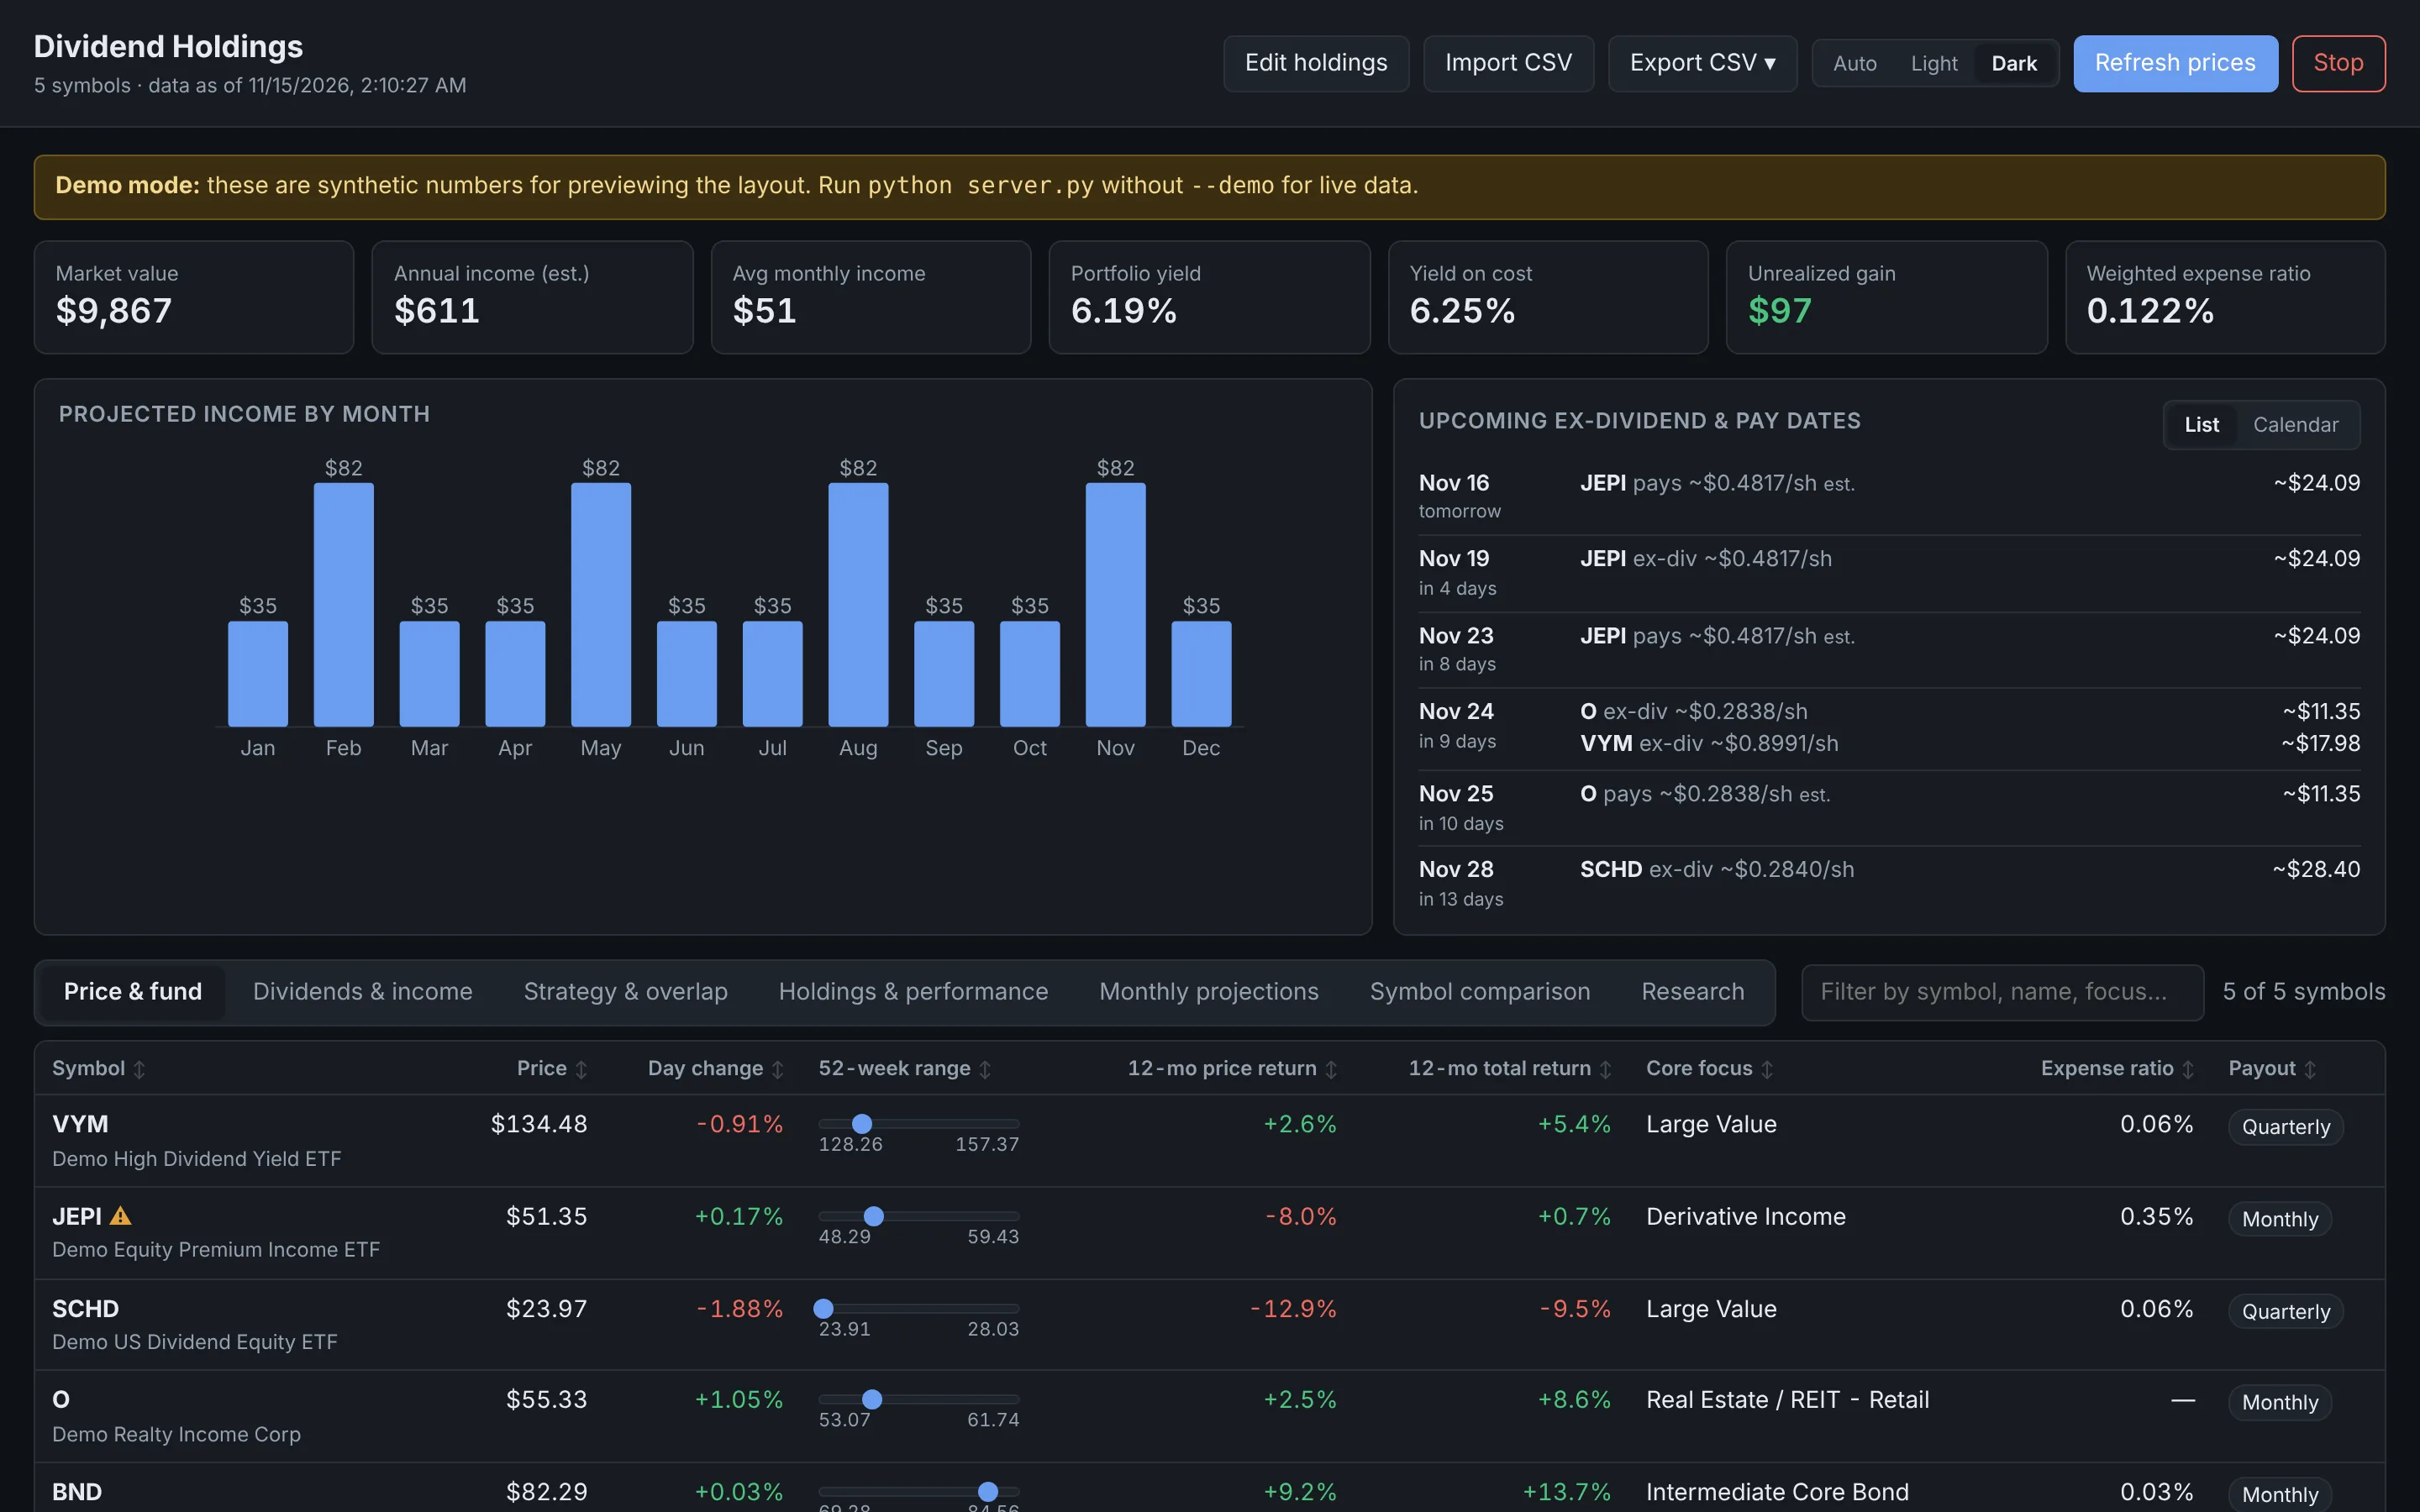
Overview
Summary cards, projected income by month and upcoming ex-dividend dates.
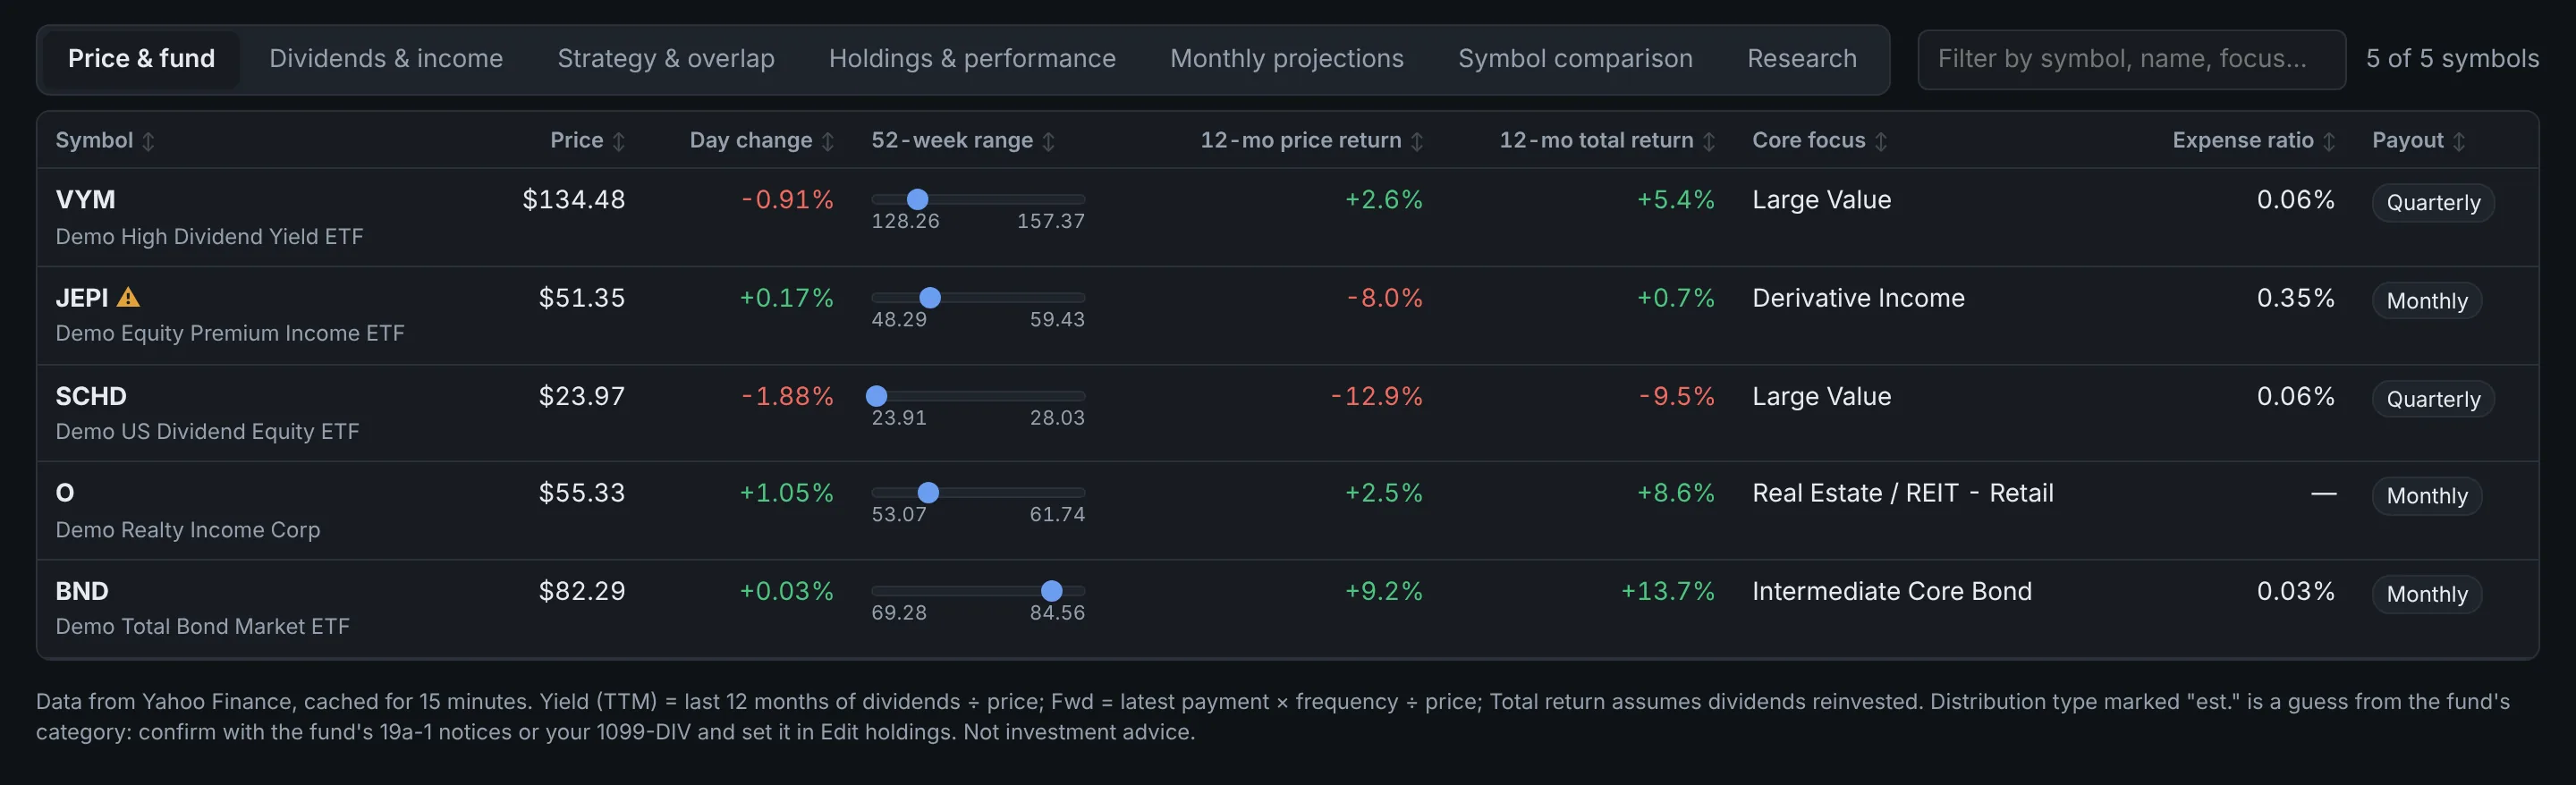
Price & fund
Main table with price, 52-week range, category and expense ratio.
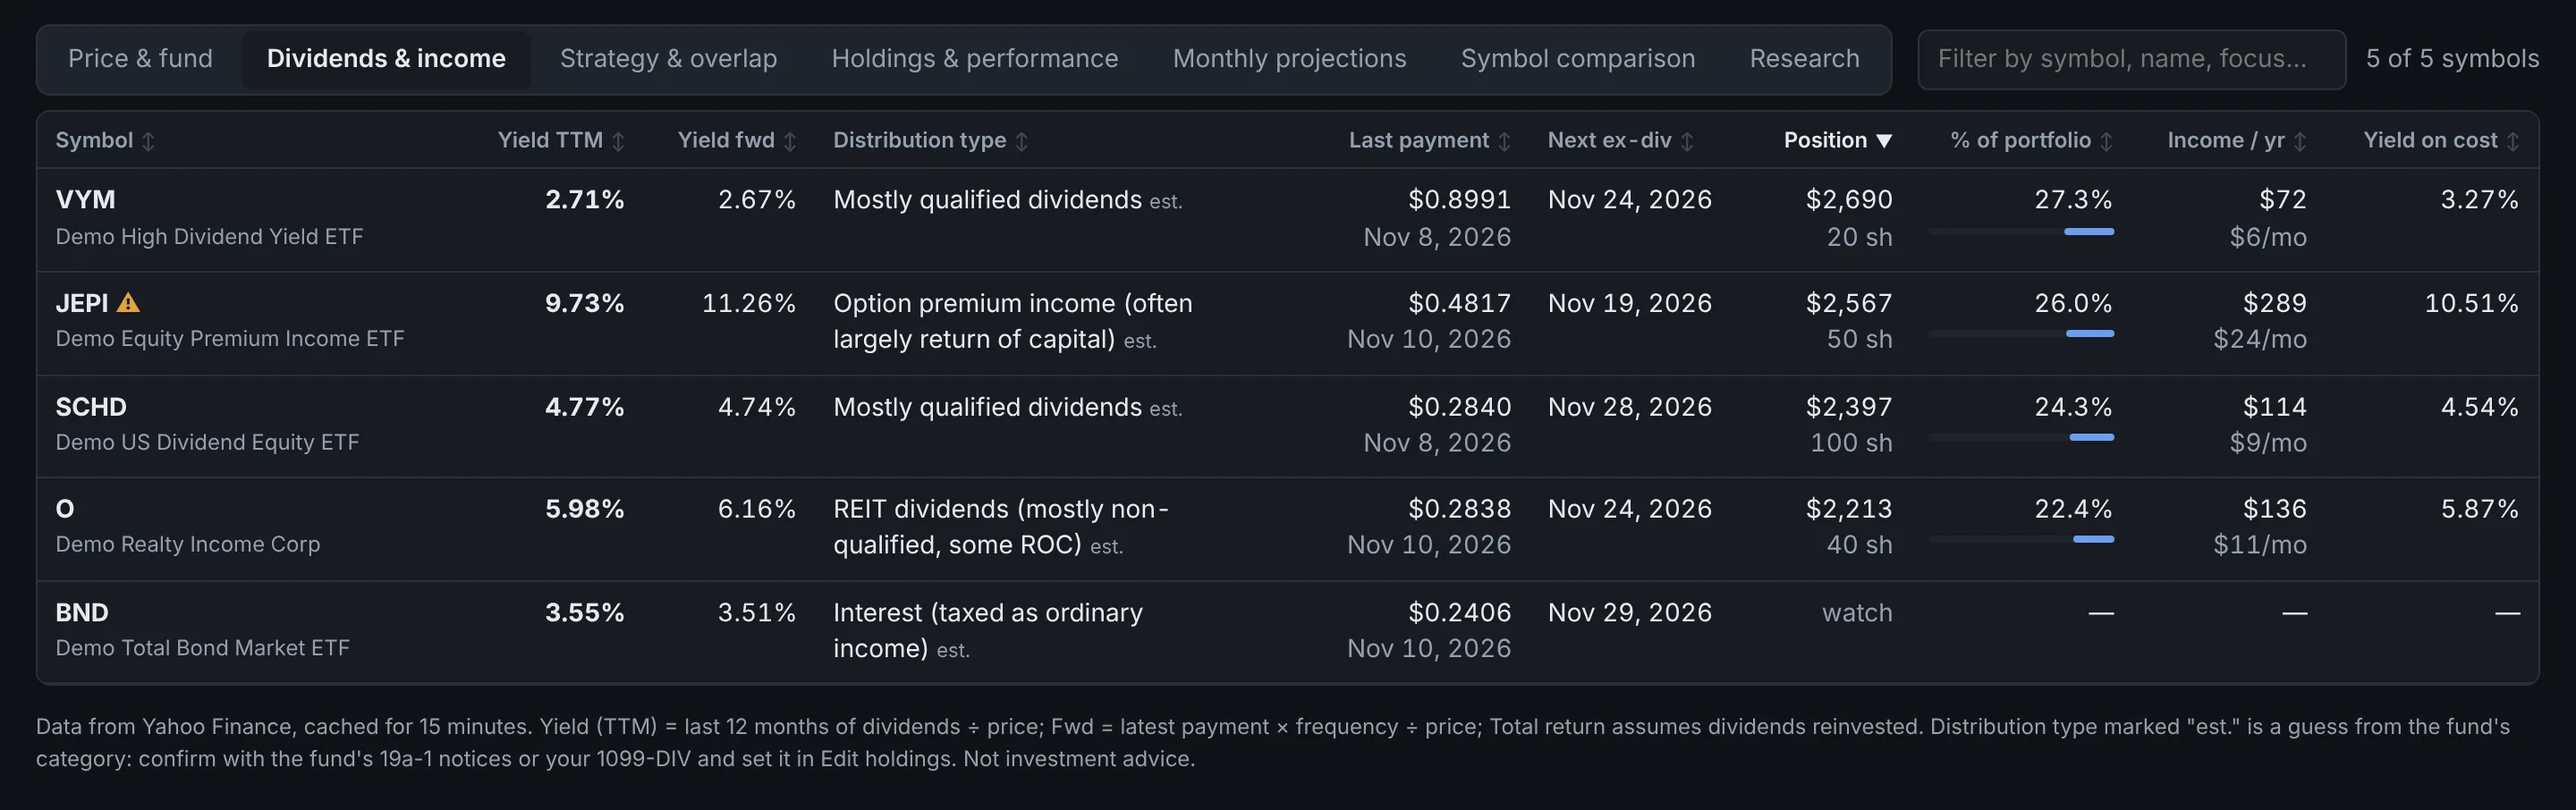
Dividends & income
Yields, frequency, next ex-dividend date and income per holding.
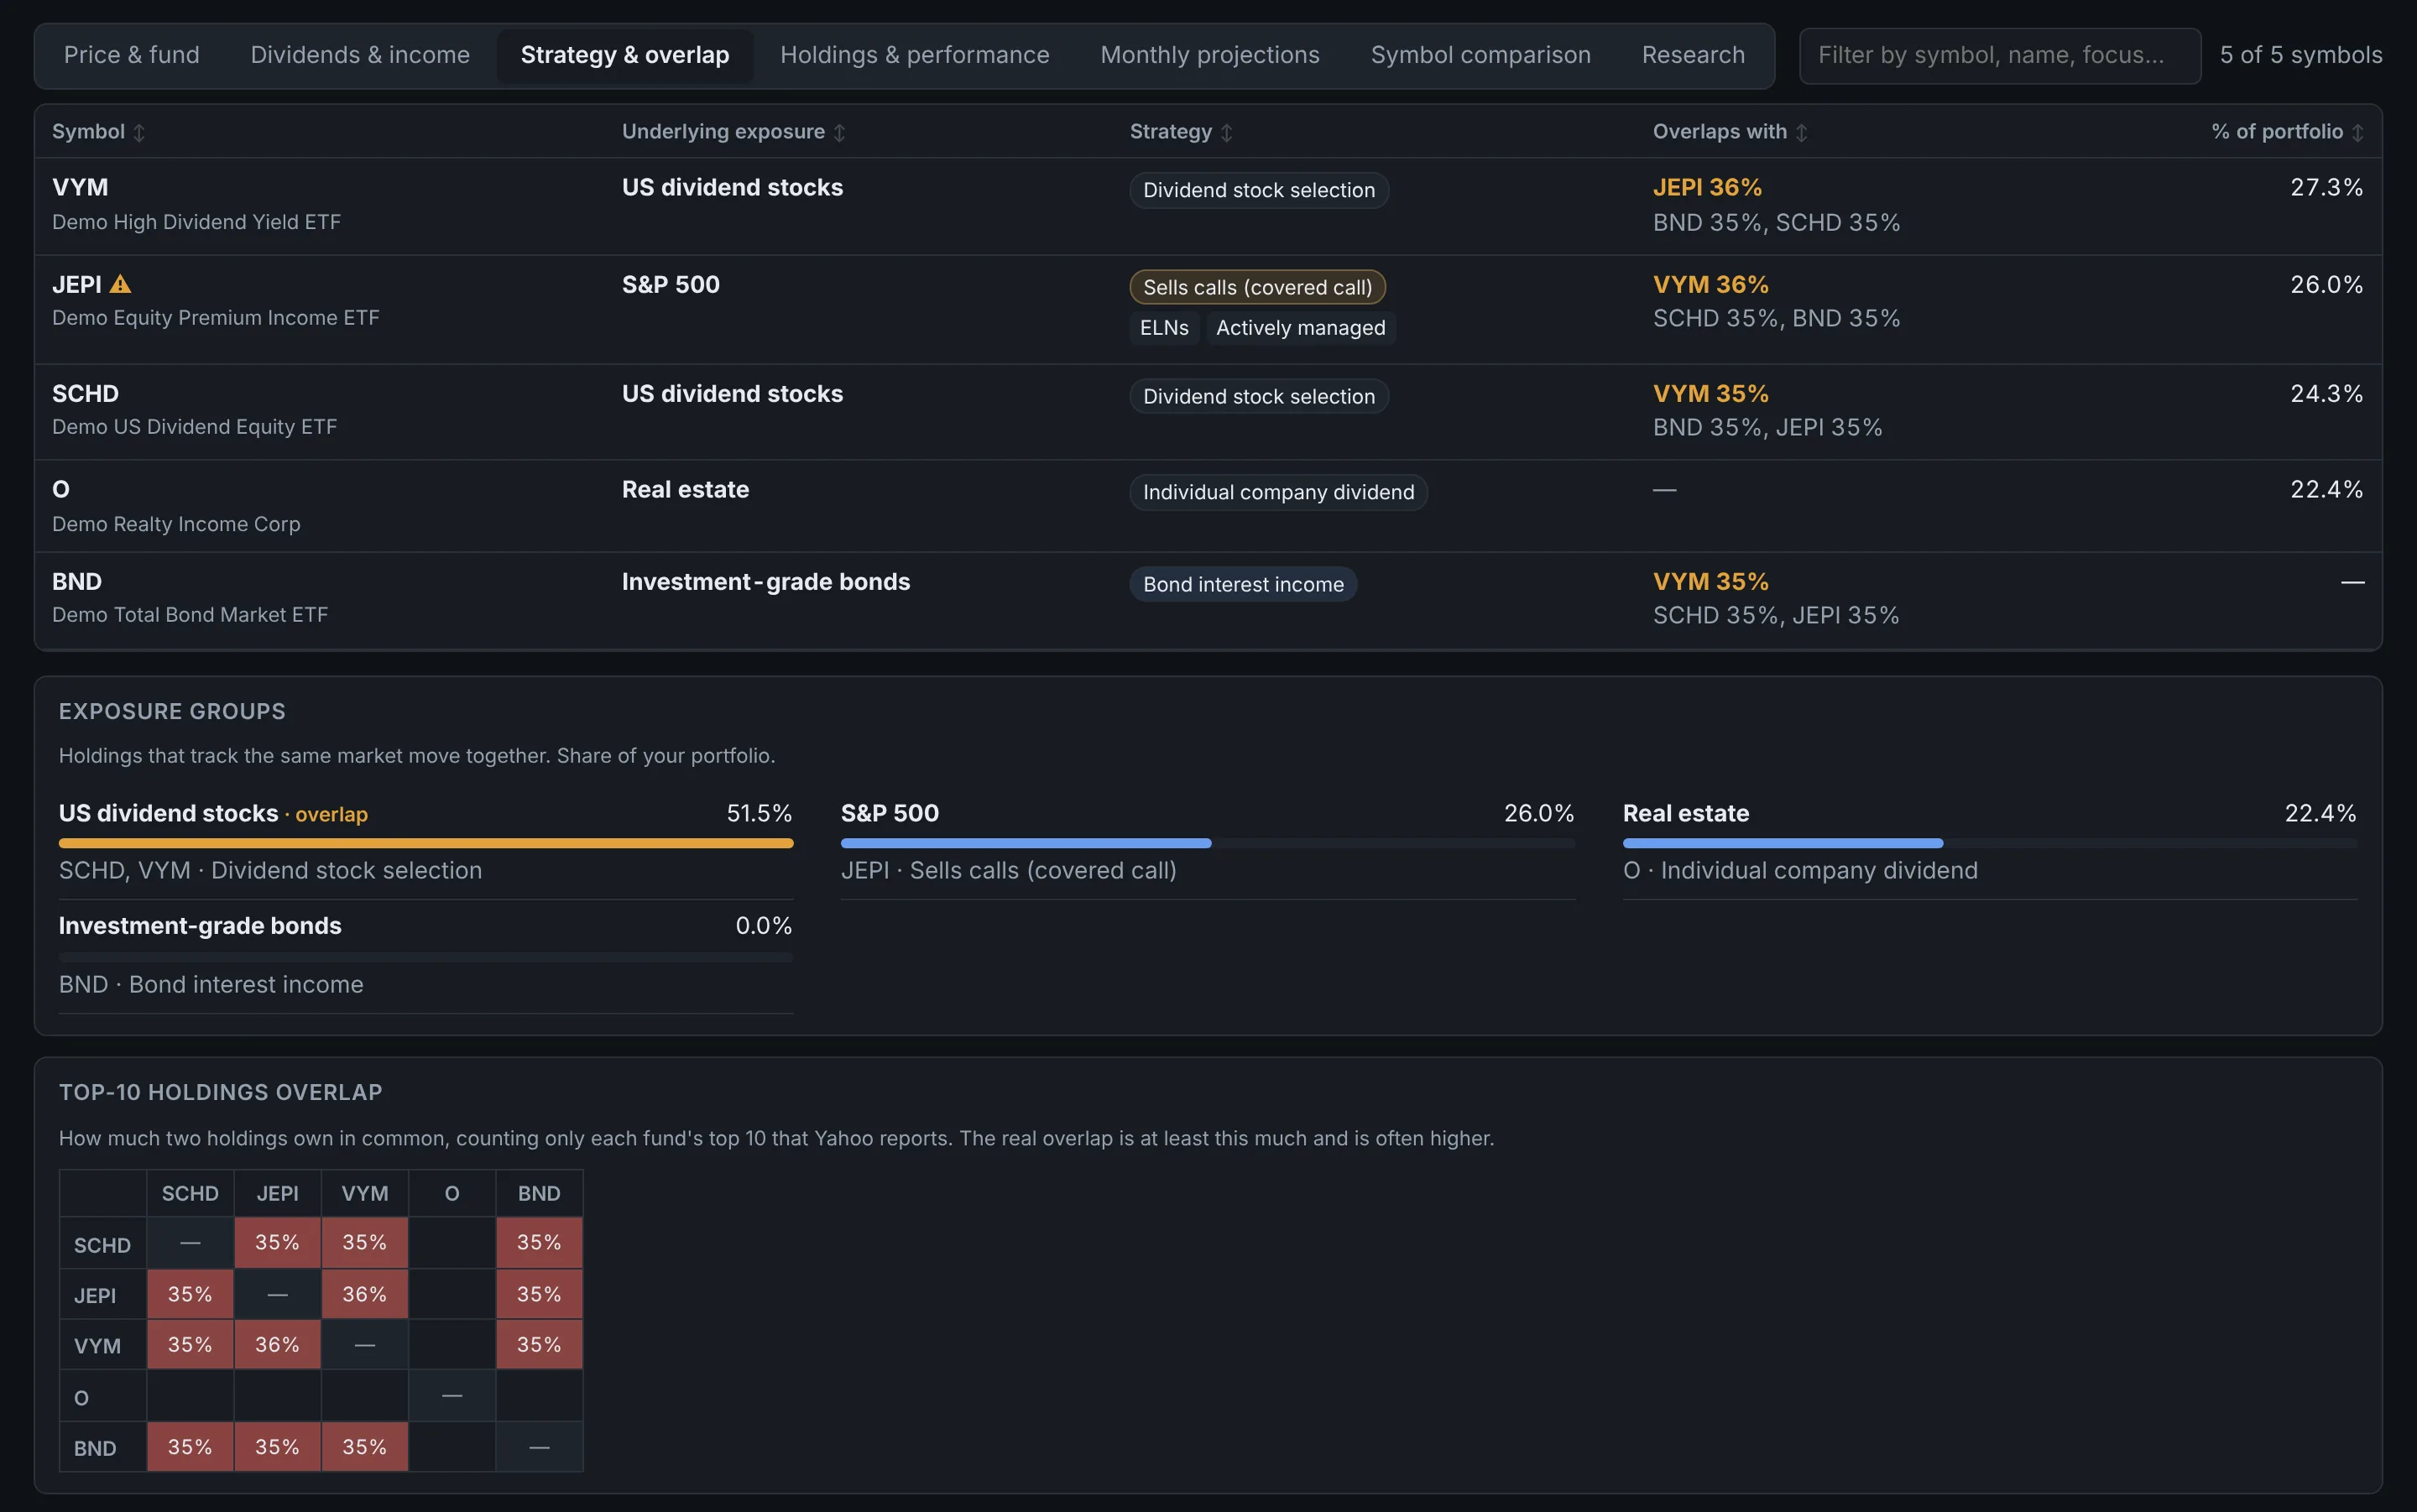
Strategy & overlap
Exposure, options strategy and overlap between funds.
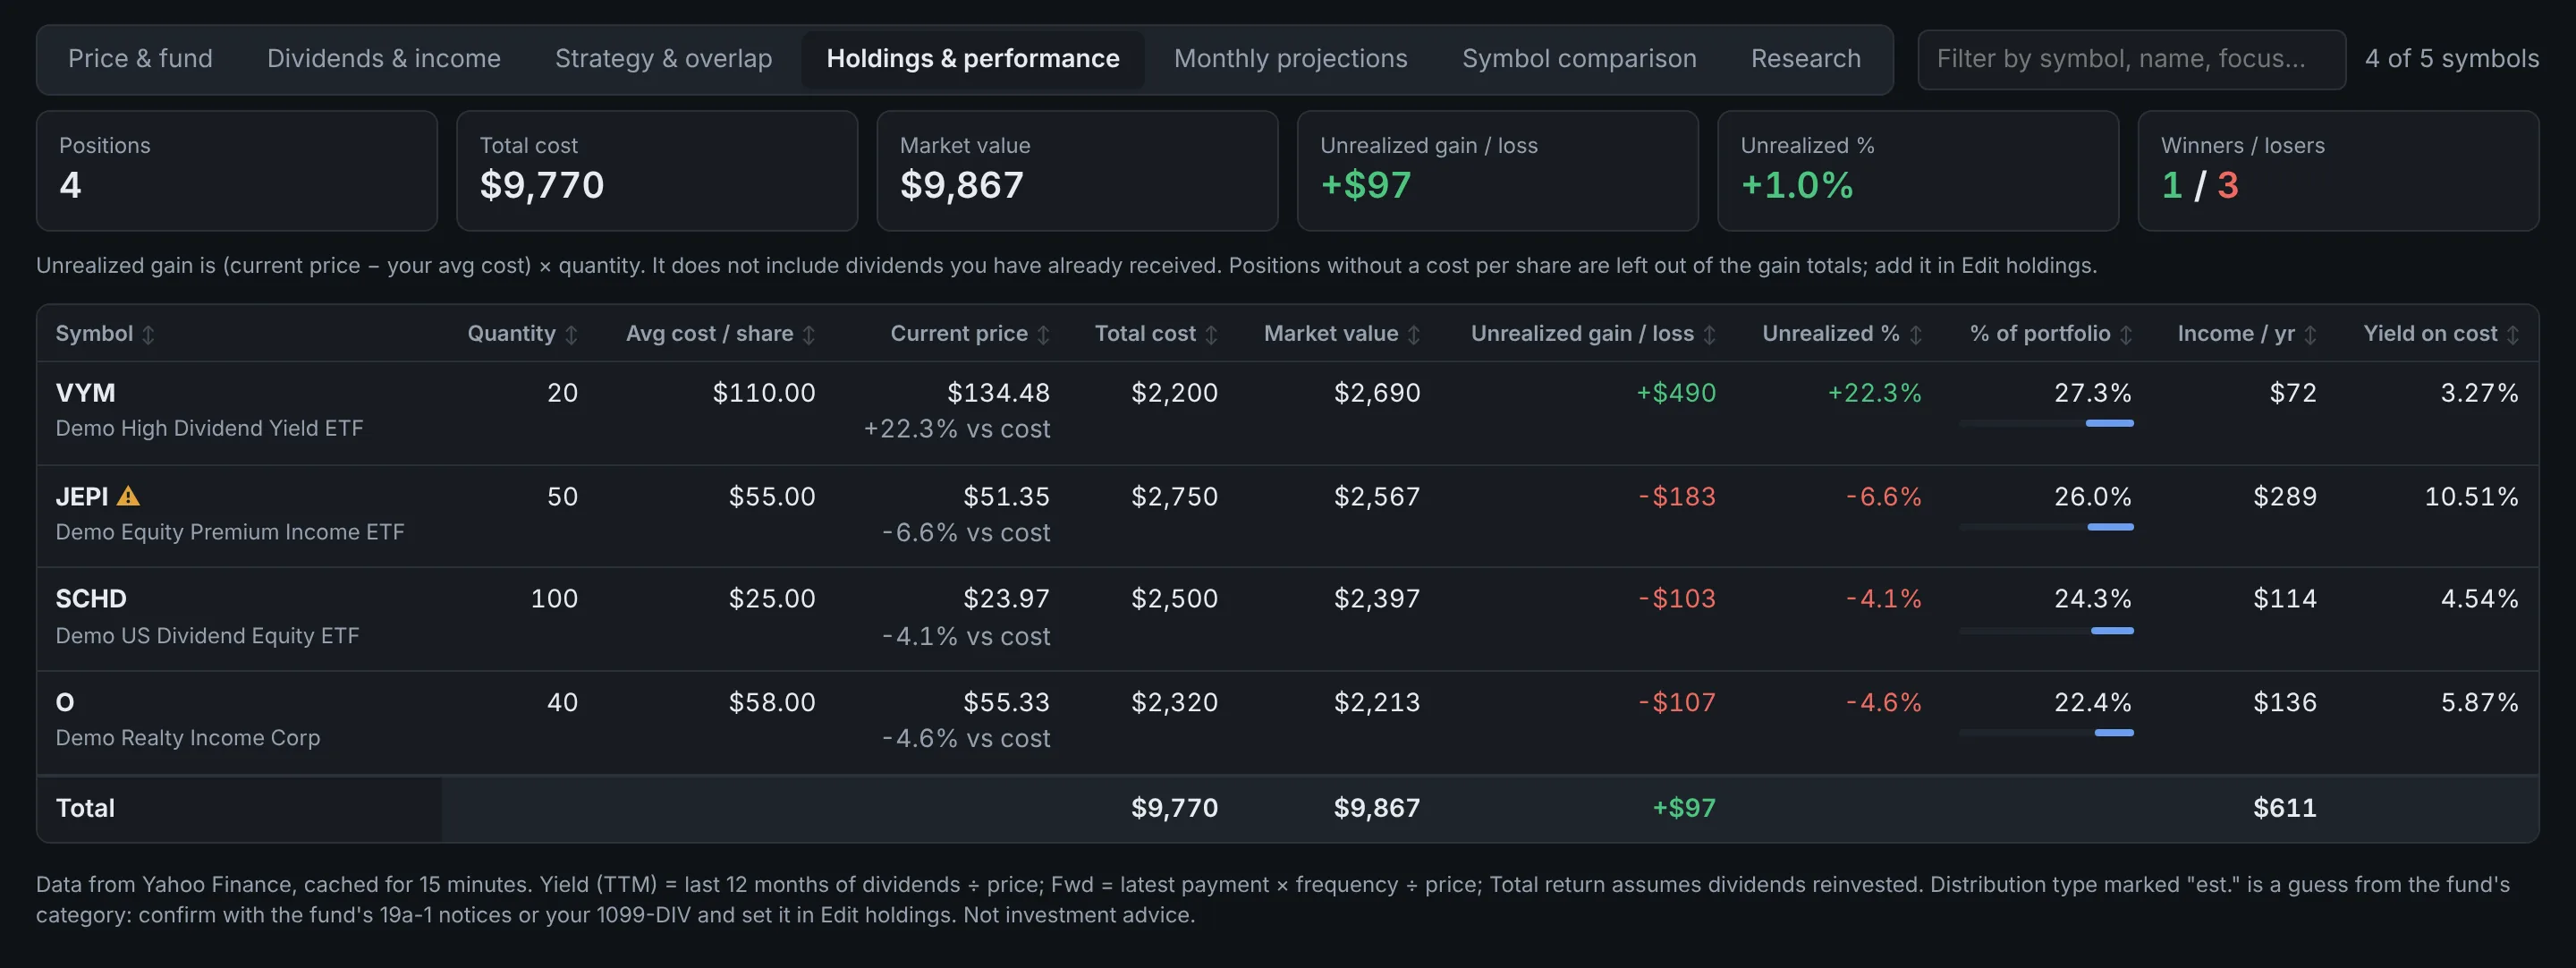
Holdings & performance
Cost, market value, gain or loss and yield on cost.
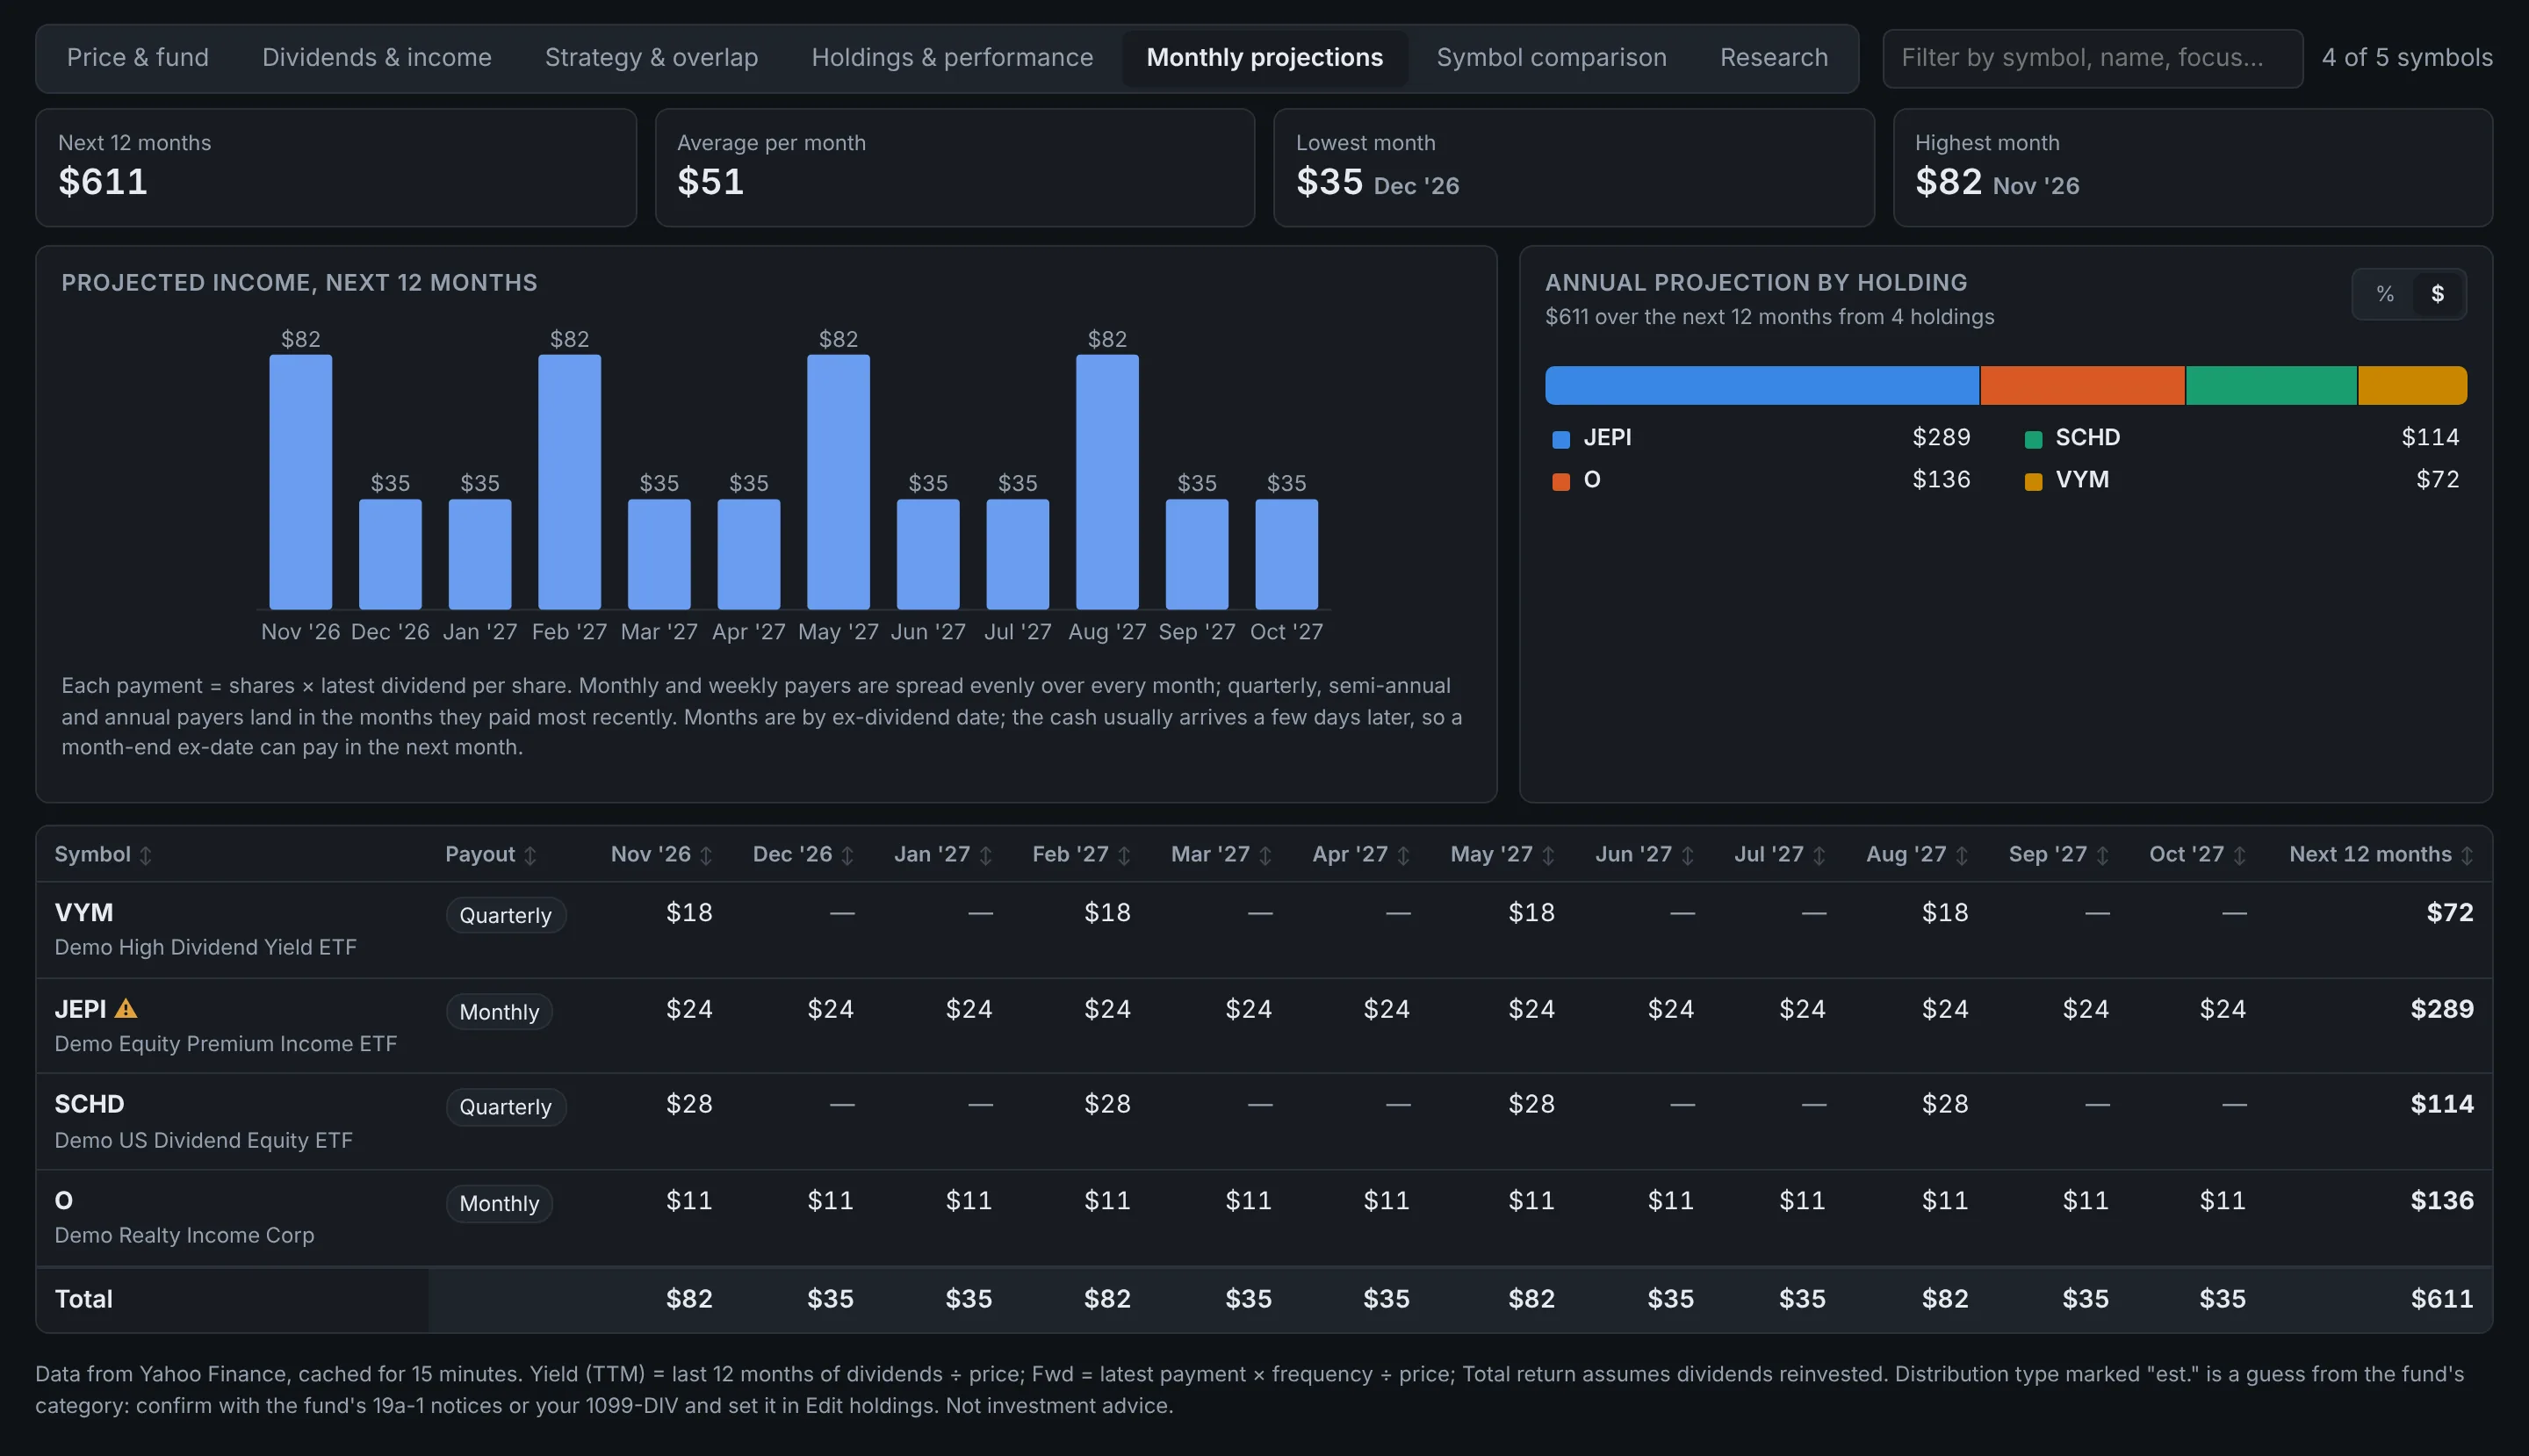
Monthly projections
Next 12 months of income by holding.
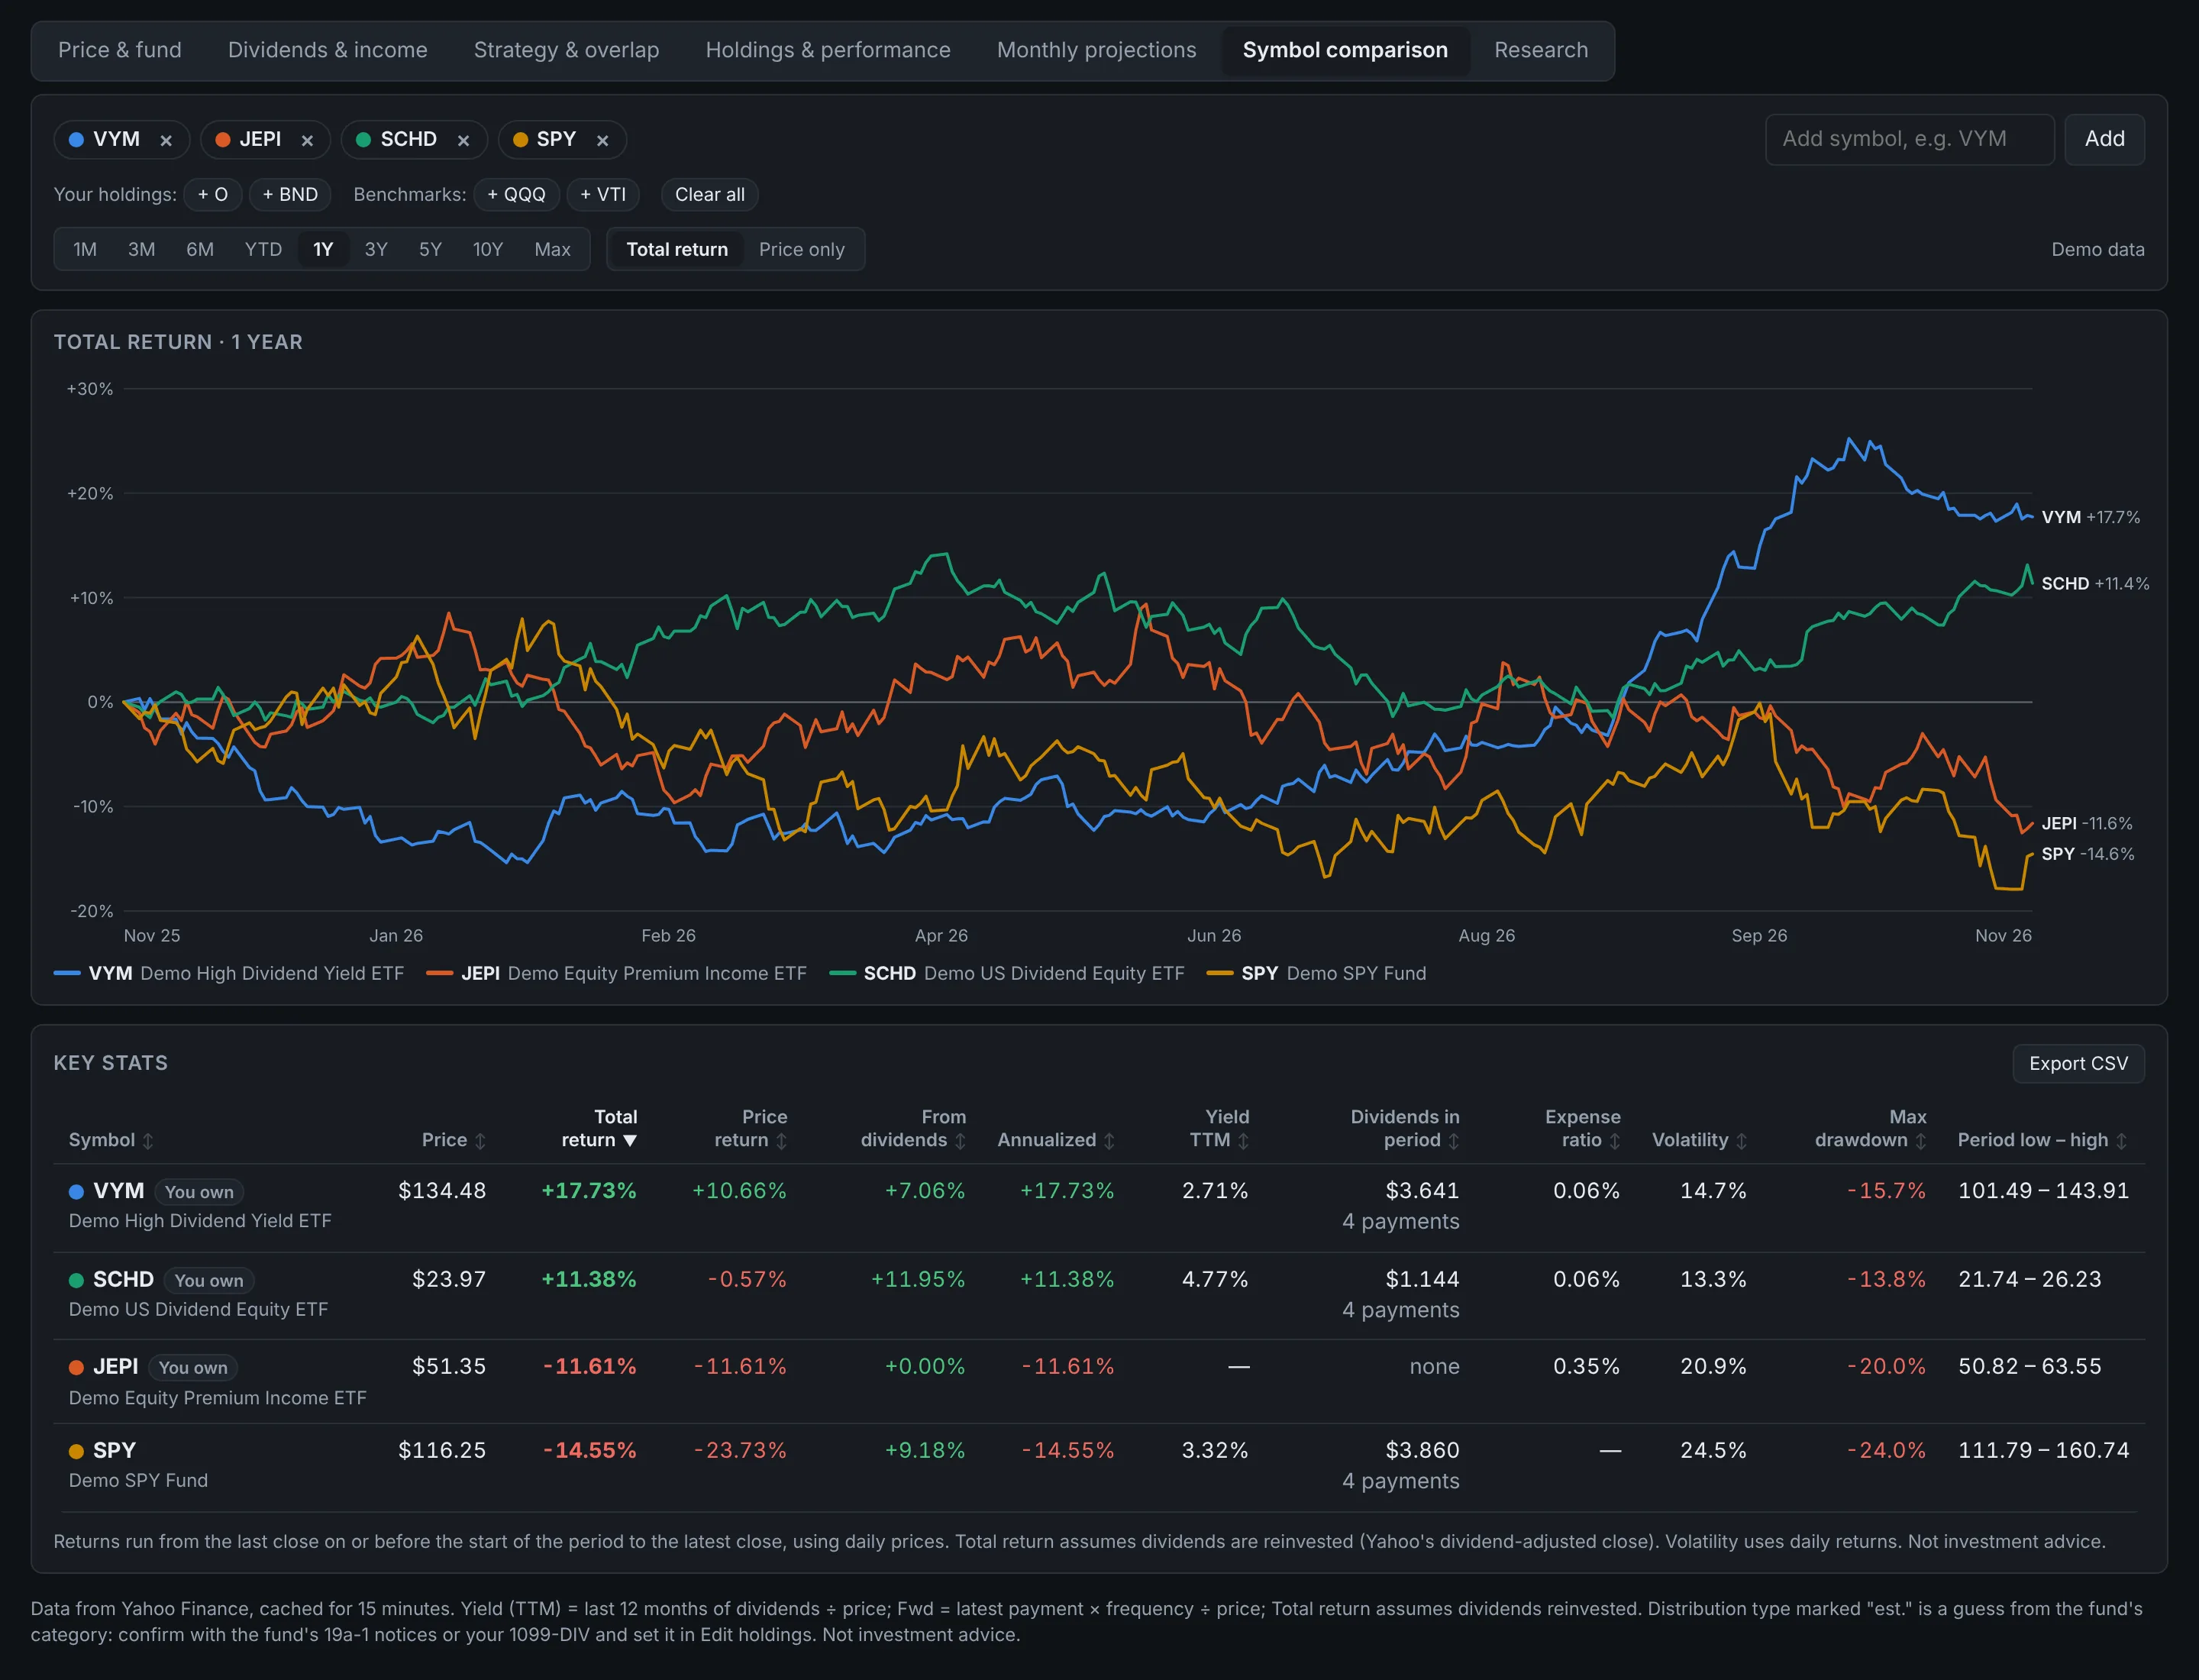
Symbol comparison
Up to 10 tickers compared over a chosen period.
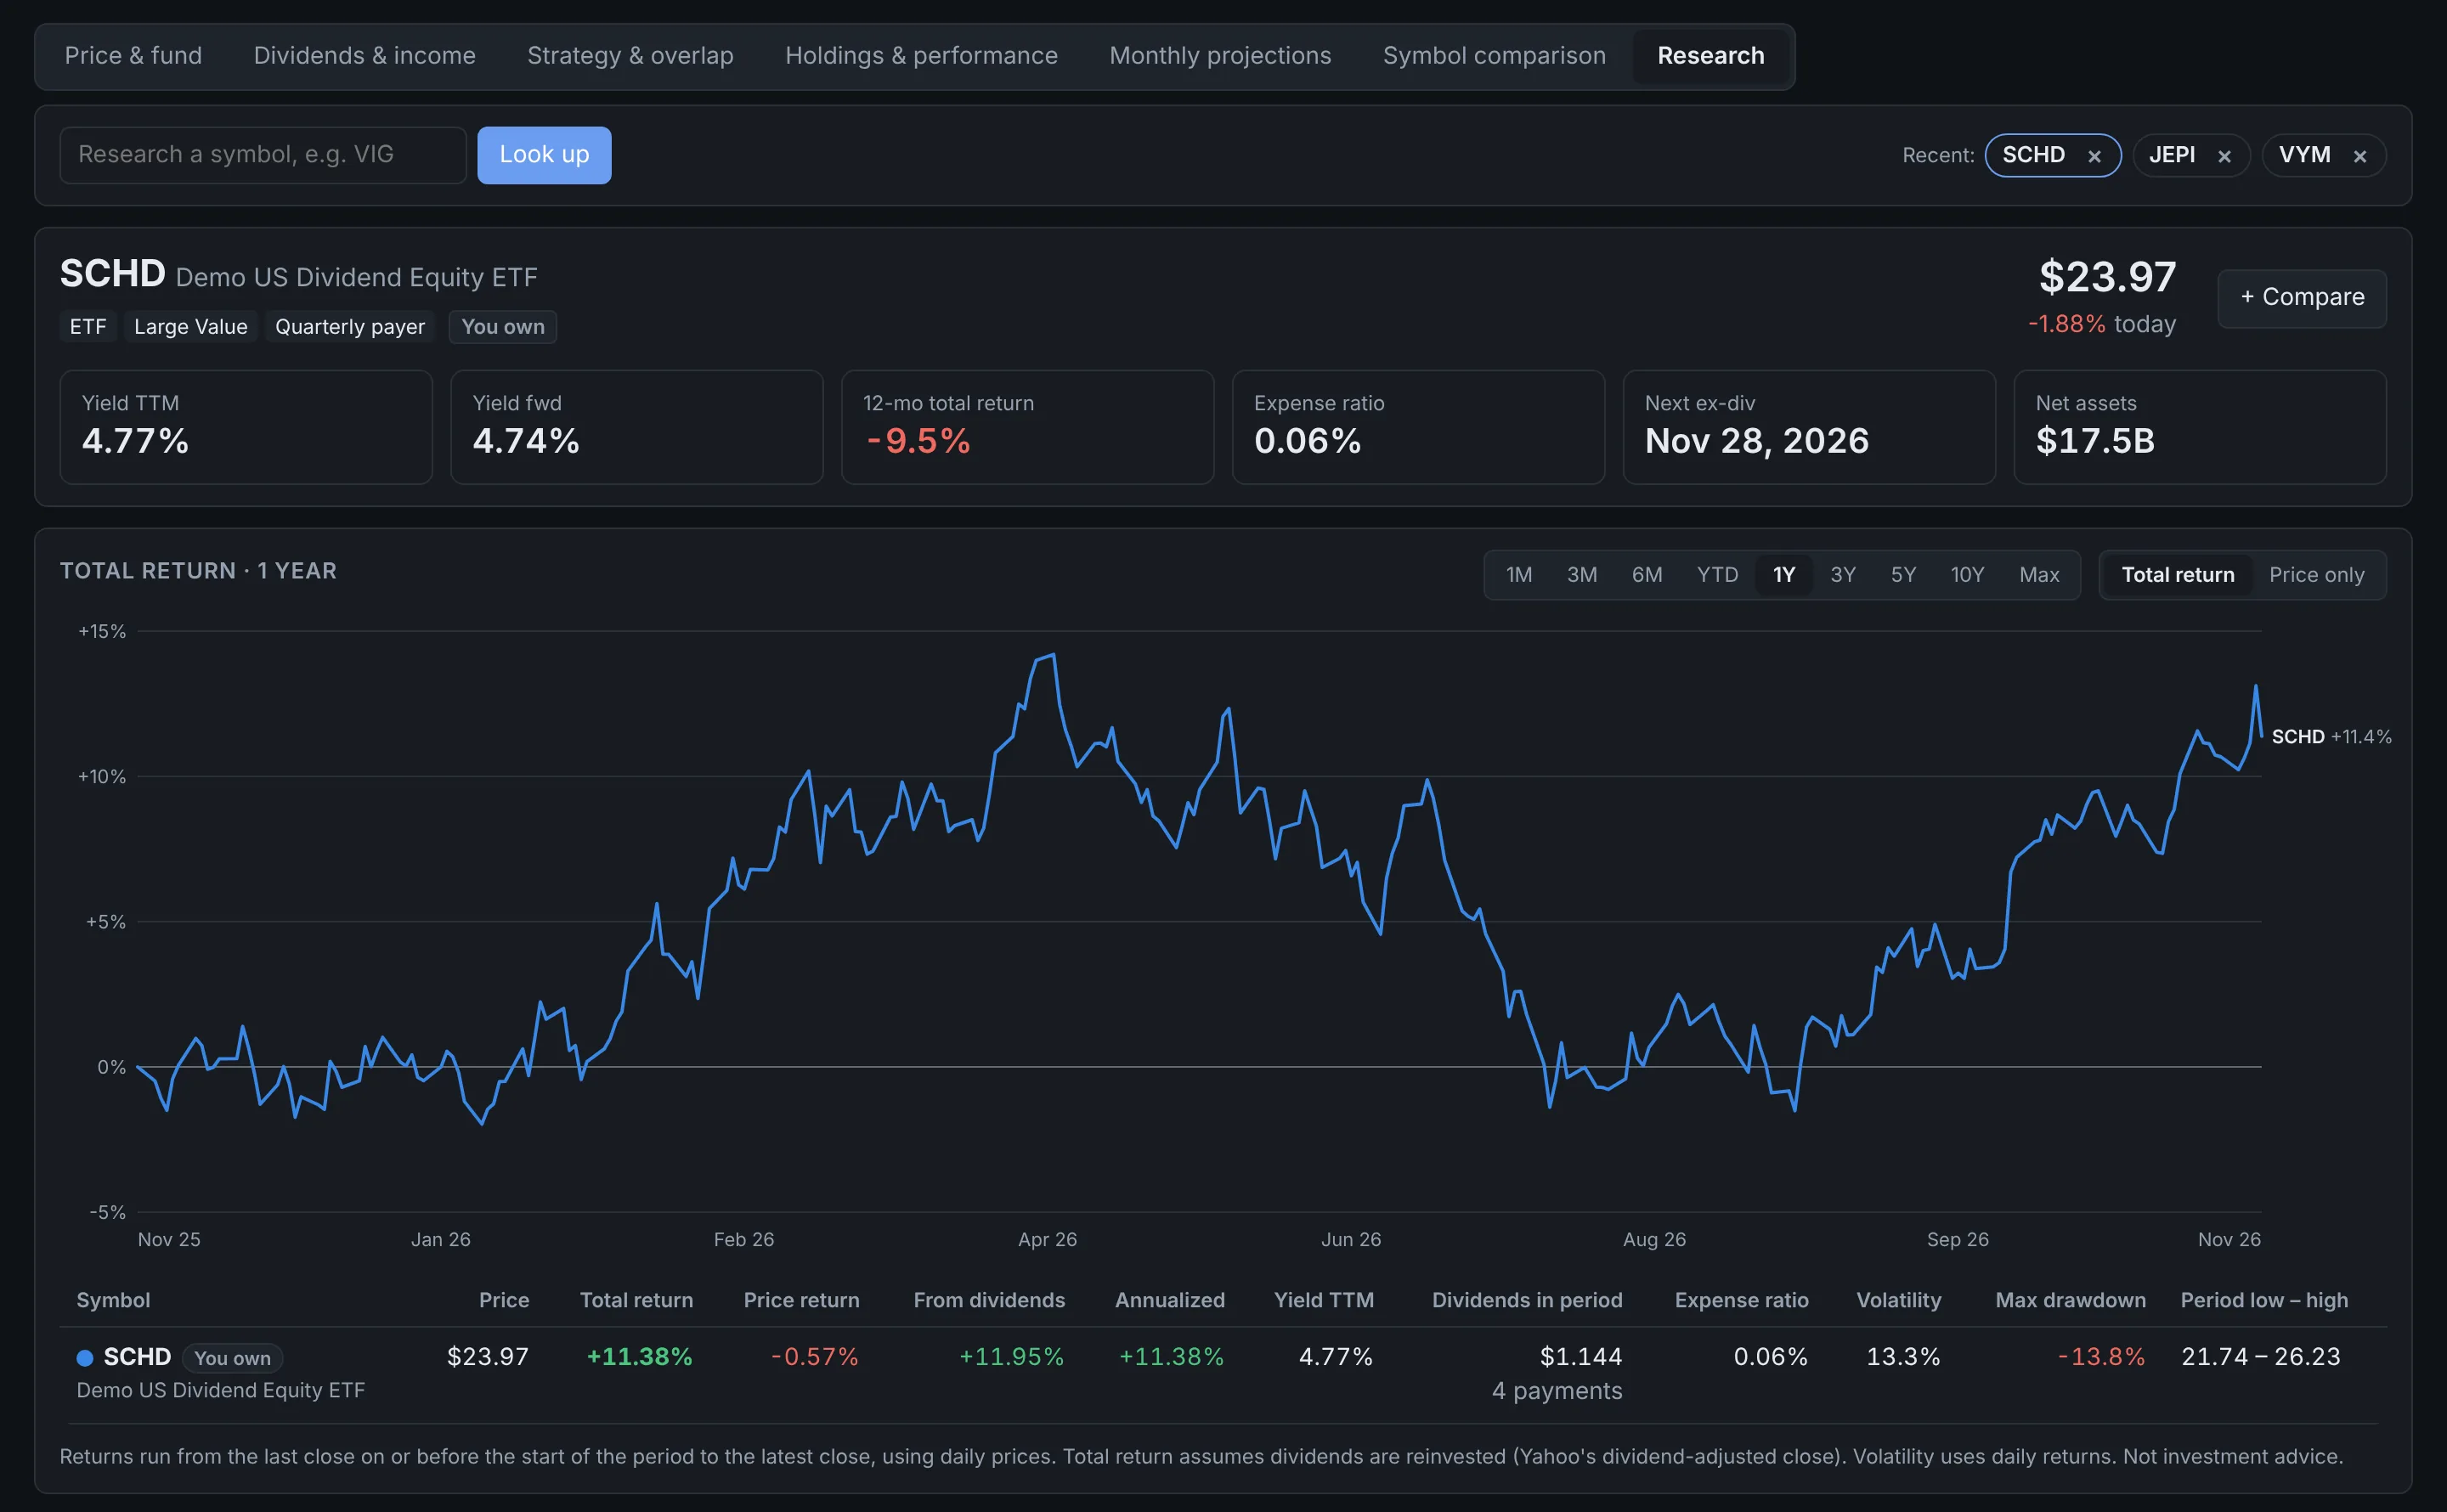
Research
Look up any symbol, held or not.